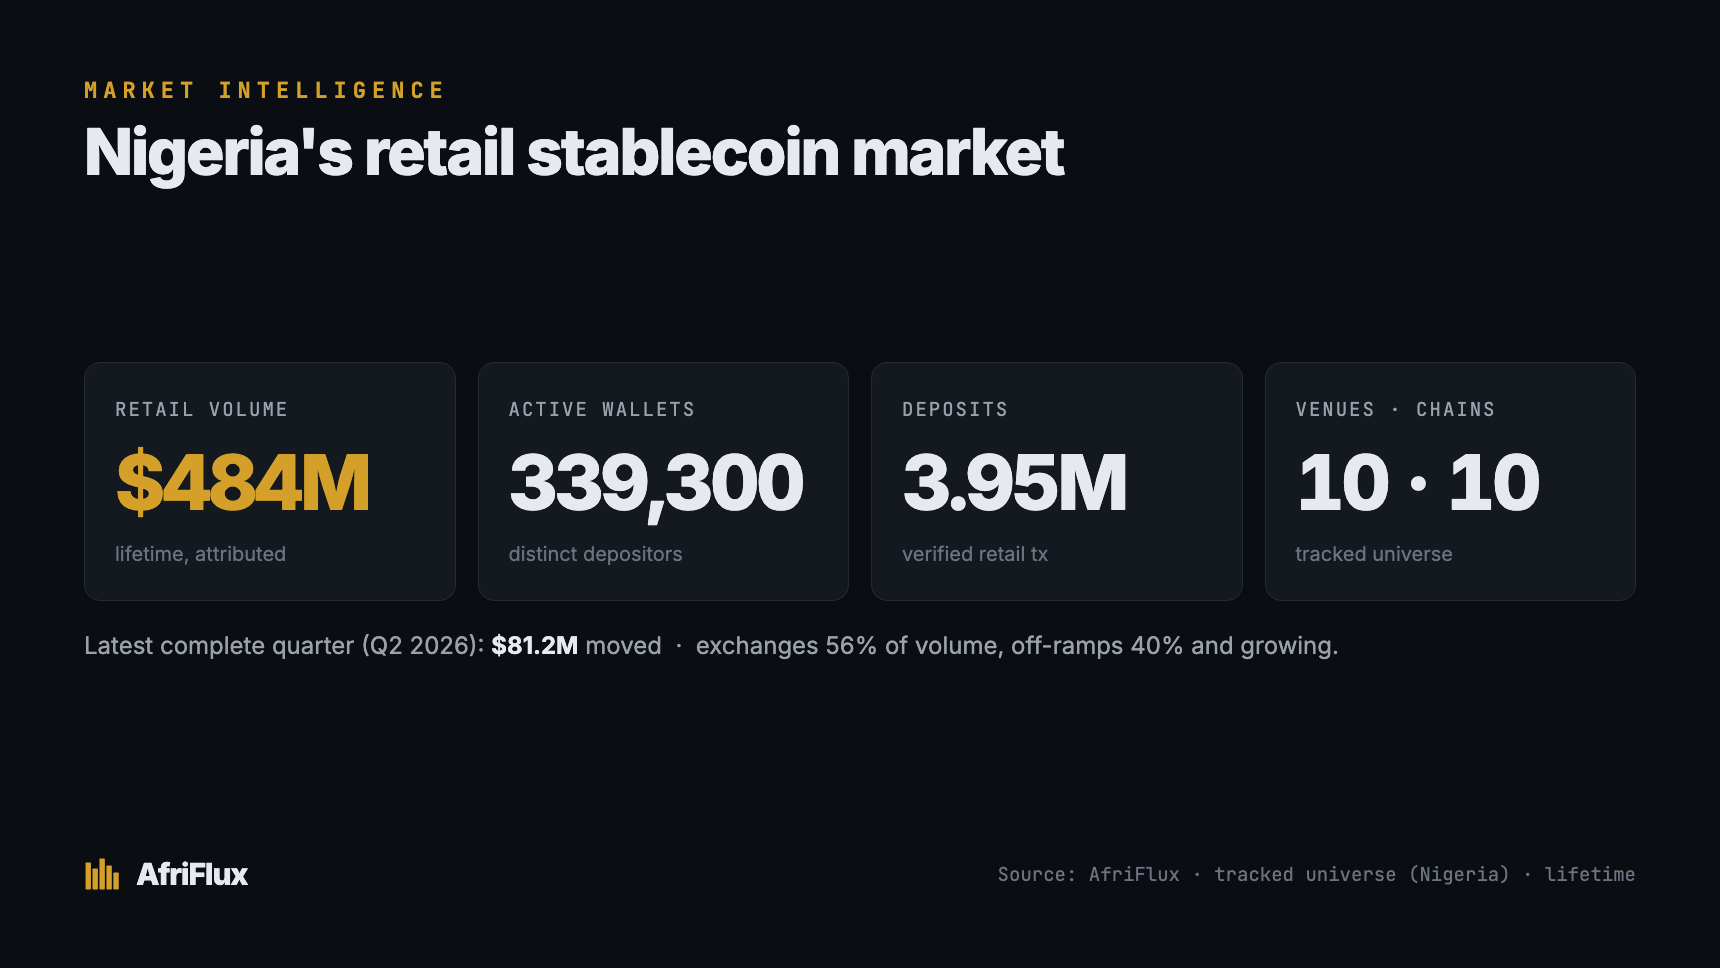
The first report in the AfriFlux Native Stablecoin Research Series.
For the past week, Nigerian crypto has been having the same argument it's had since cNGN launched: does it work? One camp points to momentum — two licensed exchanges listing it, integrations, volume climbing. The other says the opposite: fintechs aren't integrating it, builders aren't building on it, and the activity is concentrated in a few big players, not real users.
Both sides reach for the same evidence. cNGN has processed roughly ₦163 billion in onchain transfers. Bulls read that as traction. Skeptics read the shape of it as concentration. Everyone is reading the same number and arguing about what it means.
We think the number is the wrong place to start.
Transfer volume measures movement. It does not measure usage. ₦163B moving between a treasury and its own operational wallets is a fundamentally different thing from ₦163B moving between businesses, merchants, and consumers — and raw volume cannot tell the two apart. So before asking whether cNGN is winning or losing, we asked a narrower, answerable question:
Of that ₦163B, how much is actual economic activity — and how much is infrastructure moving money in circles?
To answer it, we didn't invent a framework. We borrowed the one the industry already uses.
The method: measuring stablecoins the way Visa does
In 2024, Visa — with the onchain data firm Allium, plus Artemis and Castle Island Ventures — built a public dashboard whose entire purpose is separating real stablecoin usage from noise. Their methodology is now the closest thing the industry has to a standard, and its headline result is blunt: once you strip inorganic activity, roughly 90% of "stablecoin volume" is bots and automated infrastructure, not humans. Their adjusted figure was about a tenth of the raw one.
The filters are specific, and they're the ones we applied to cNGN:
- Single-directional volume — within one transaction, only the largest transfer counts. This removes the redundant internal legs of a complex smart-contract interaction.
- Adjusted address filter — exclude addresses whose activity looks automated rather than human, removing high-frequency and bot wallets.
- Category labels — tag activity as exchange, DEX, lending, mint/burn, and so on, so infrastructure can be separated from use.
- Retail-sized — flag genuinely small transfers, the signature of consumer activity.
We layered in one more adjustment, from the other end of the institutional spectrum. The Bank for International Settlements, in its 2026 Annual Report, notes that headline stablecoin volume is far lower once you net out transfers between wallets owned by the same party. So we strip same-entity internal rotation too — a venue shuffling funds between its own wallets isn't economic activity, it's housekeeping.
Where we adapted it — and why we had to
Visa's numeric cutoffs were tuned for a ~$250 billion stablecoin universe. Their thresholds flag any address sending more than 1,000 transactions or $10 million in a 30-day window.
Applied to cNGN, those numbers are meaningless. cNGN's entire 19-month transfer history is about $115 million — so a "$10M in 30 days" filter would essentially never trigger. Importing Visa's absolute figures would classify almost nothing as inorganic.
So we kept Visa's structure and recalibrated the cutoffs to cNGN's own scale, empirically. We pulled the distribution of every cNGN address's busiest month and found the point where behaviour clearly turns automated: a tiny sliver of addresses (about 1%) carrying the overwhelming majority of volume. We set the inorganic threshold there:
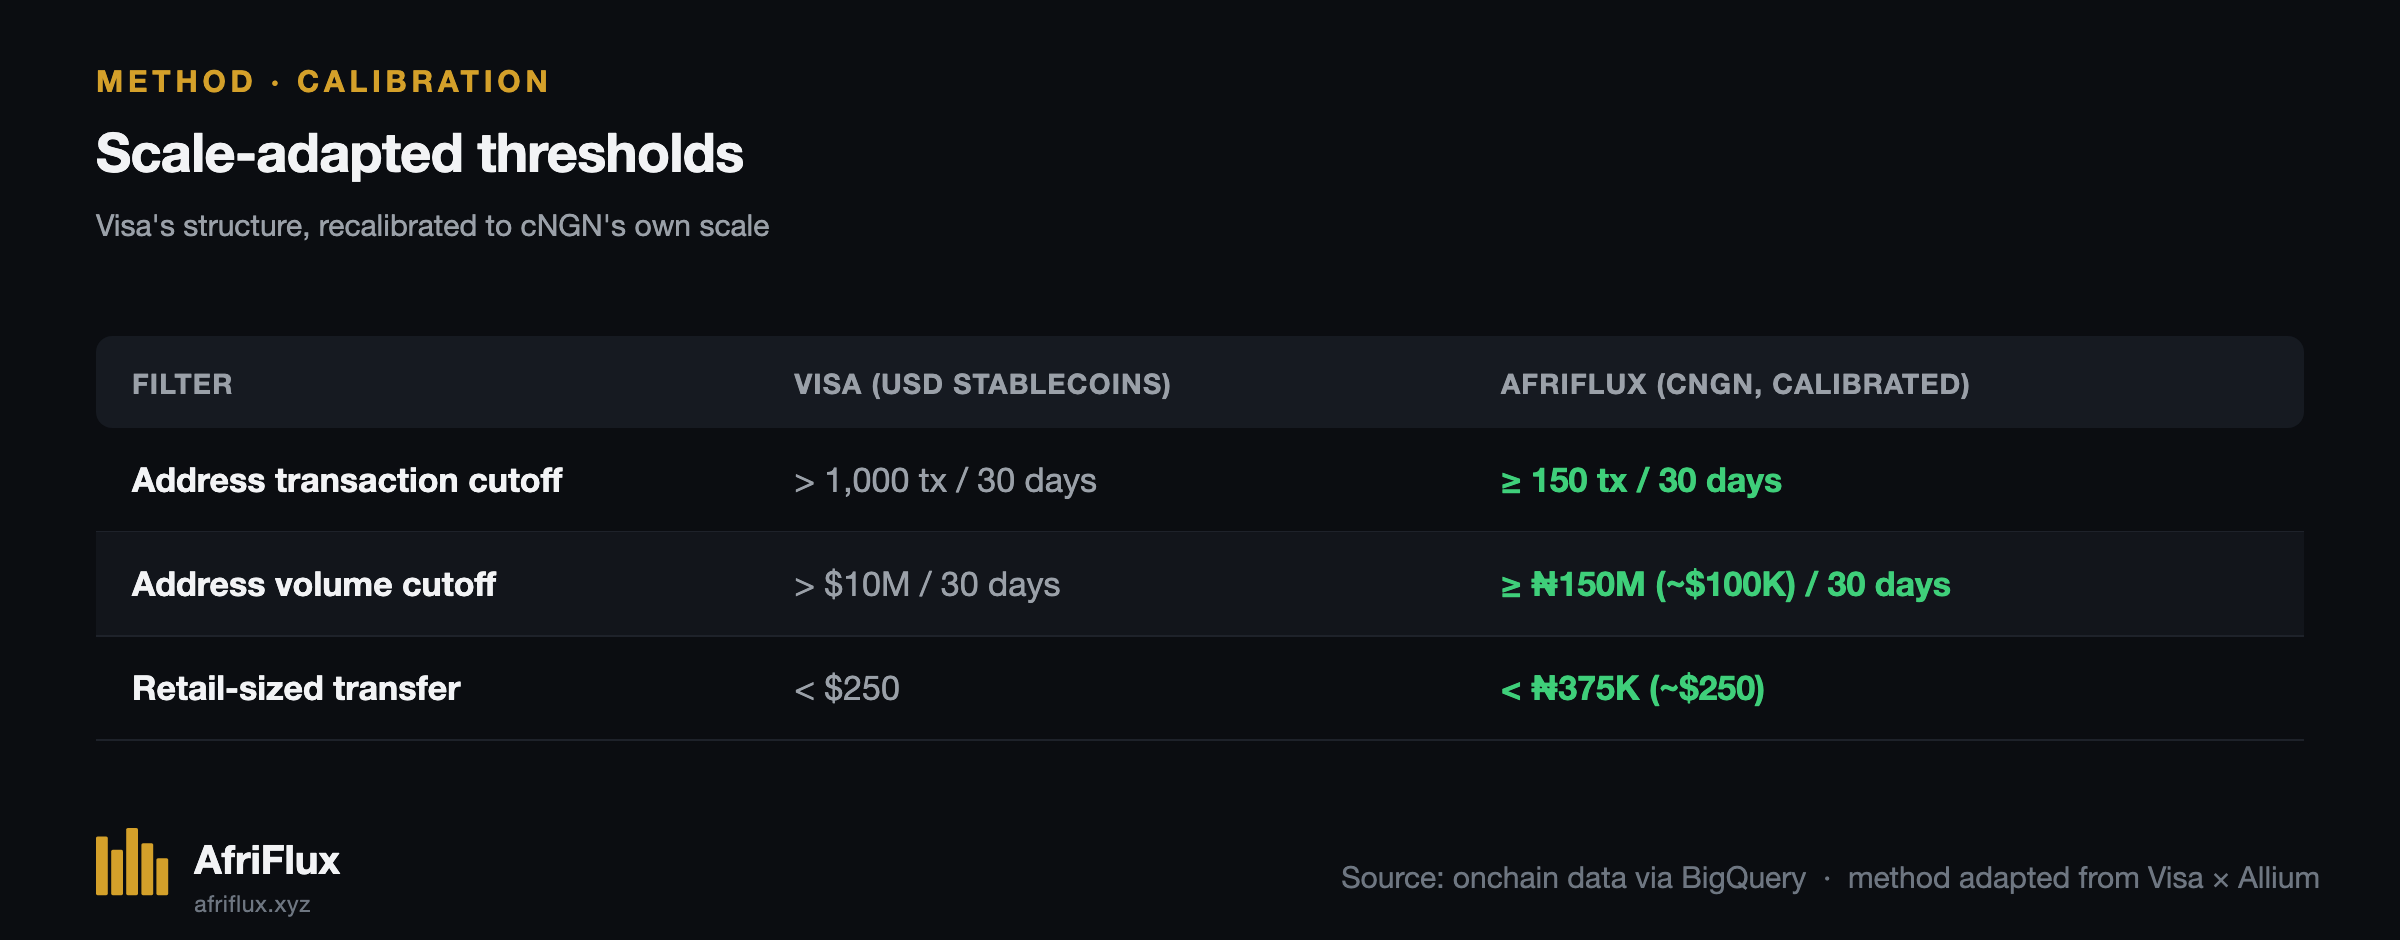
This is a methodological choice, and we're stating it in the open so anyone can disagree, re-run it, or propose better cutoffs. That transparency is the point. We're not asking you to trust a verdict; we're showing you the meter and the reading.
Finding 1: 98.5% of cNGN's volume is infrastructure
Here is cNGN's ₦163B, disassembled.
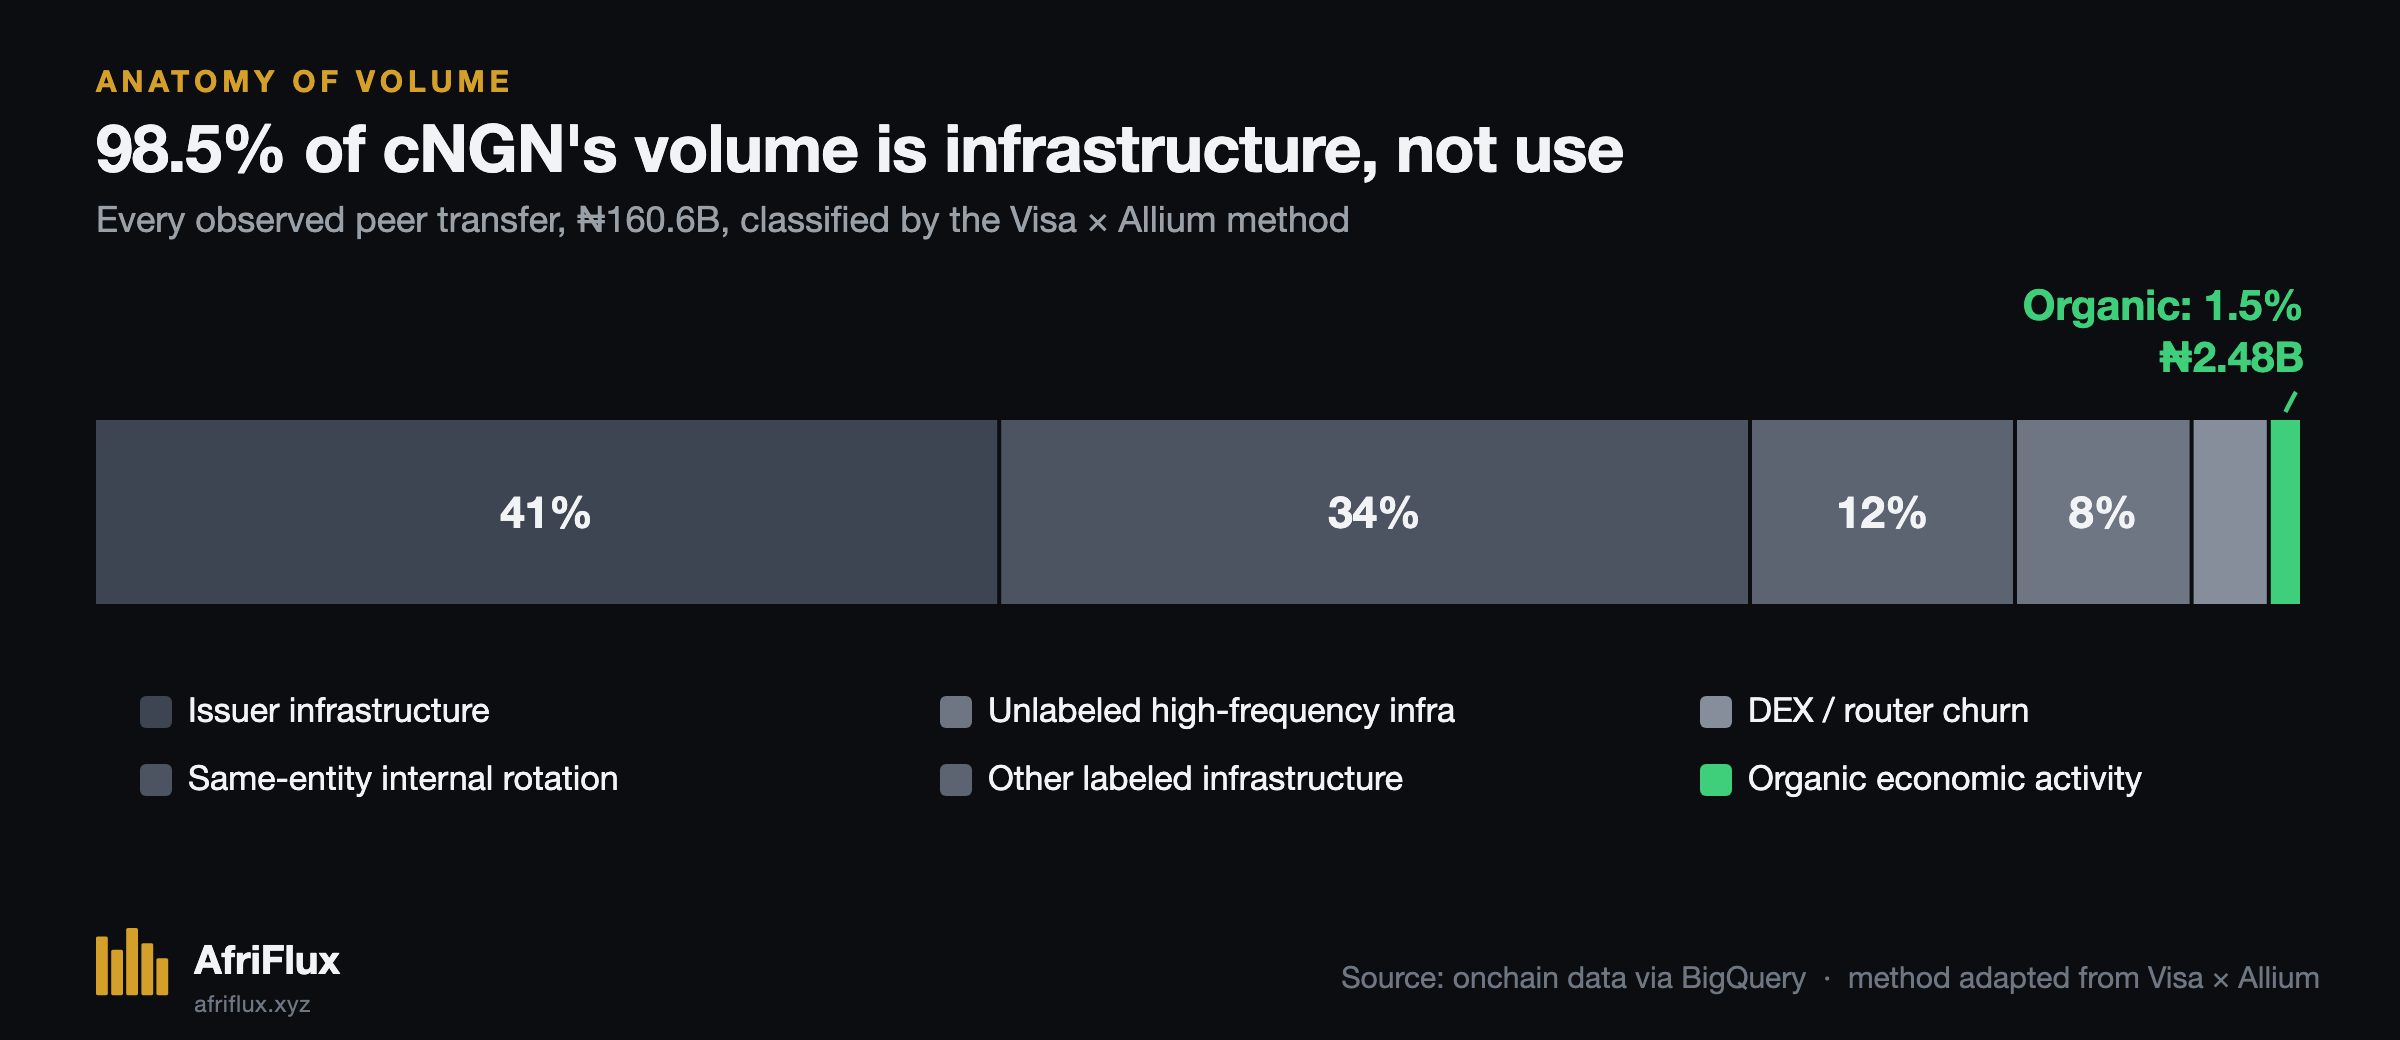
The single largest slice — 41% — is the issuer, WrappedCBDC, moving its own token through its own infrastructure. Add same-entity internal rotation (34%) — venues and the issuer shuffling funds between wallets they already control — and three-quarters of all cNGN "volume" is entities moving money inside their own walls. Another ~23% is other infrastructure: exchange hot wallets, bridges, routers, and one very busy DEX pool's bot traders.
What's left — arms-length transfers between independent parties, the thing a normal person would call usage — is 1.5%. ₦2.48 billion.
One clarification, because it matters: this is not saying the other 98.5% is fake. Infrastructure activity is real and necessary — networks don't run without treasury movement, settlement, and liquidity routing. We're saying it shouldn't be read as adoption. It's the plumbing, not the water.
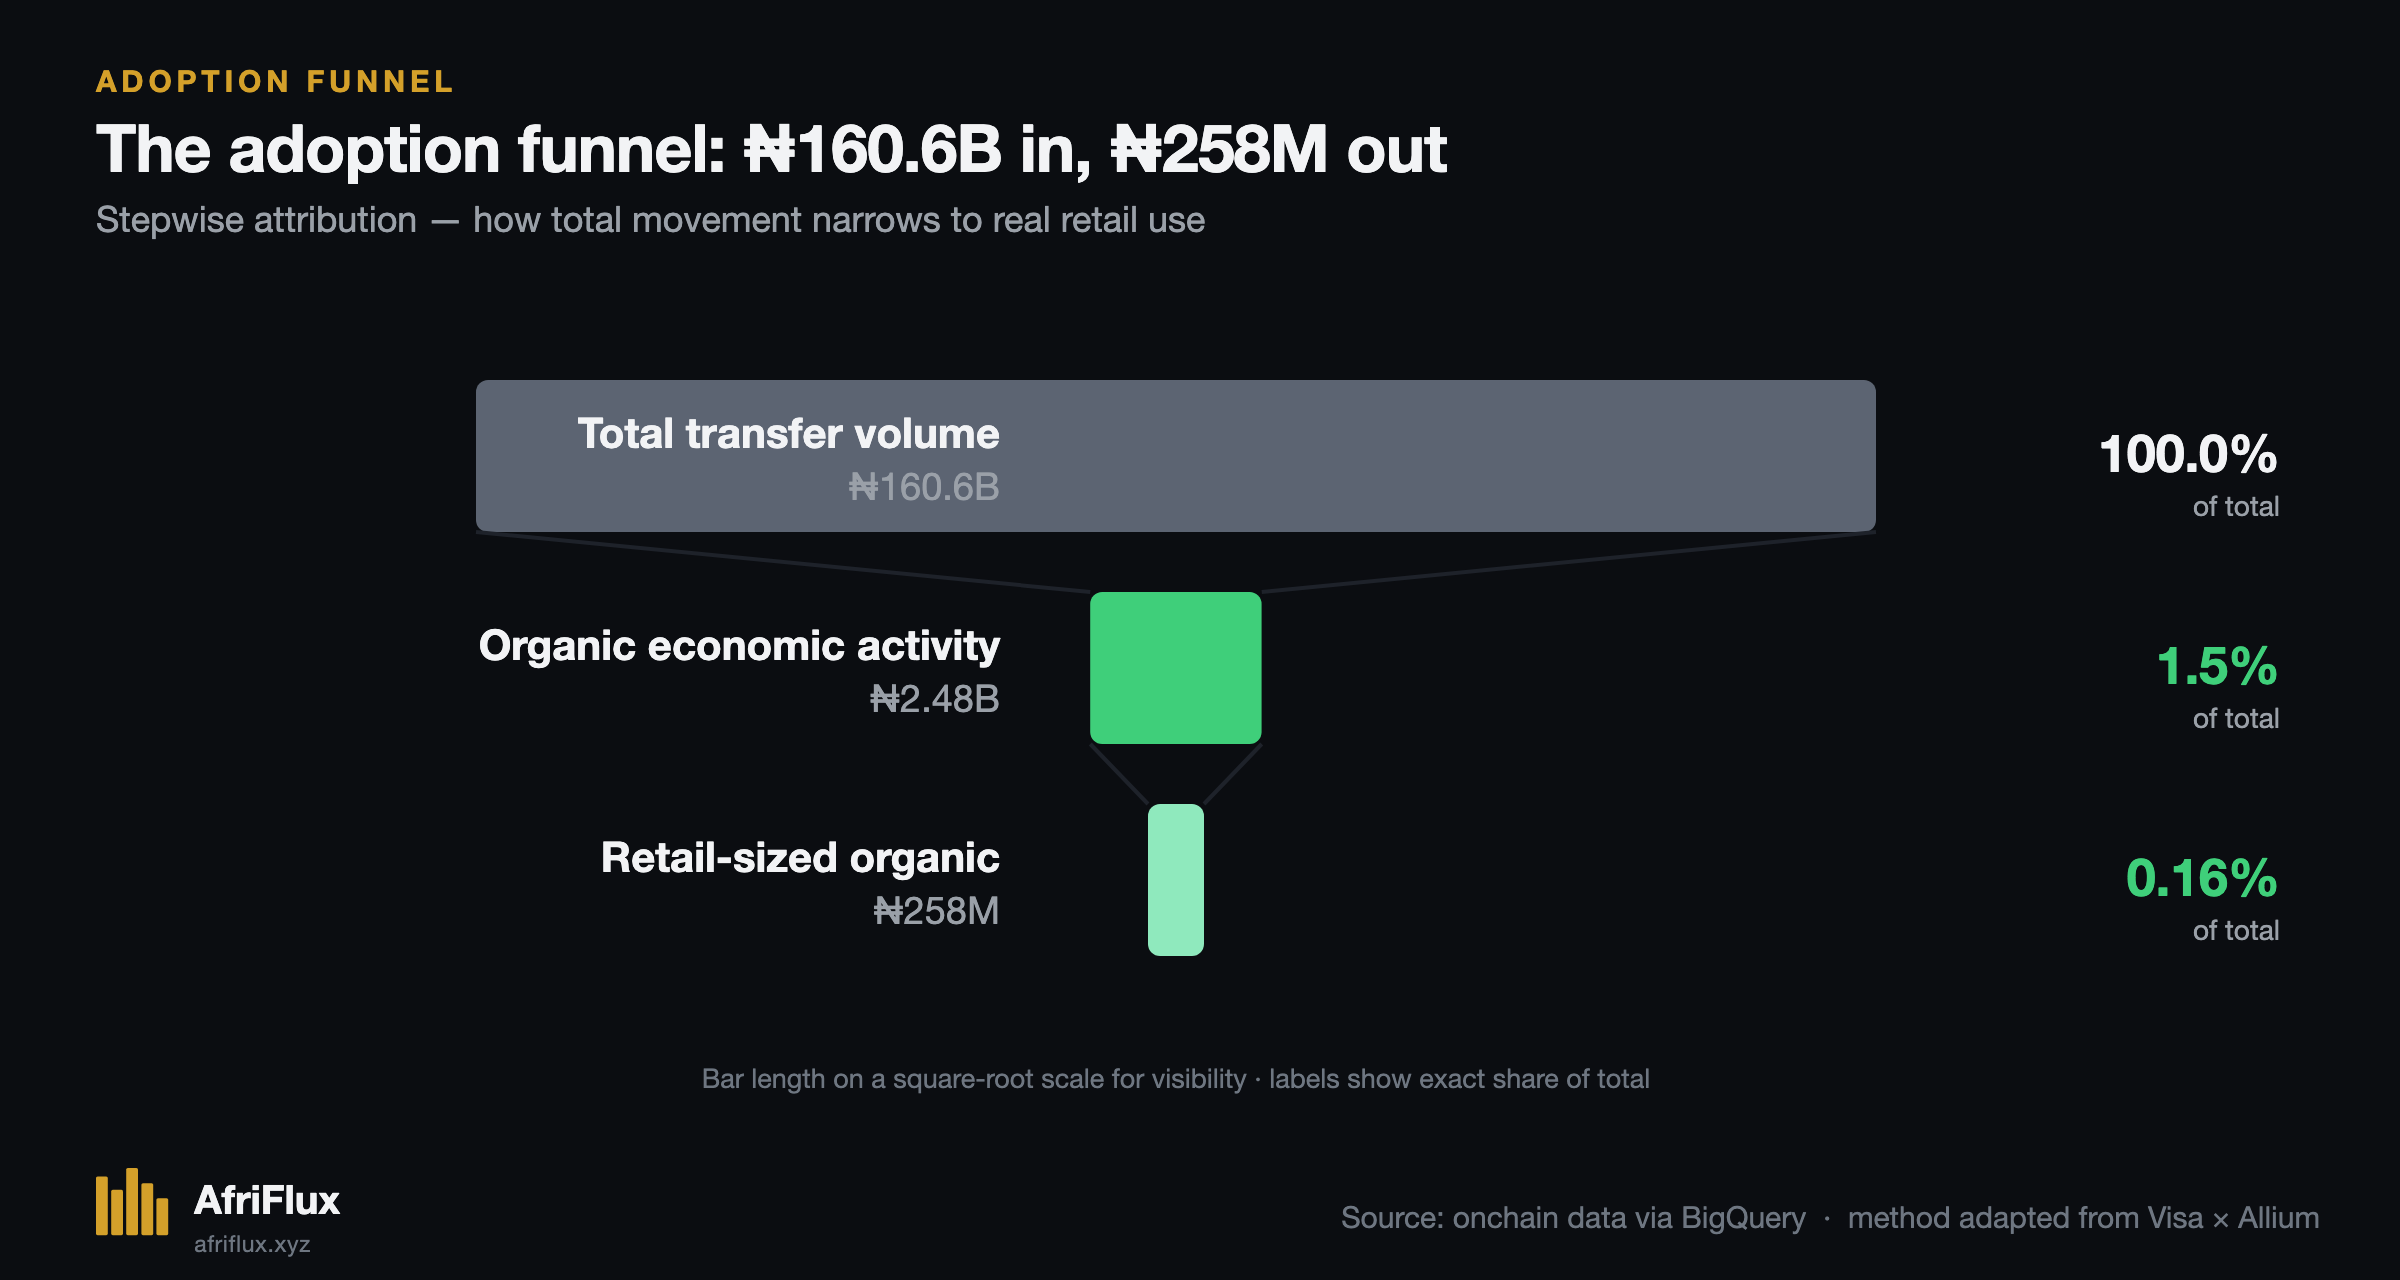
Run the full funnel and the drop-off is steep: ₦163B of total movement narrows to ₦2.48B of economic activity, and narrows again to ₦258 million of retail-sized organic flow — roughly one-sixth of one percent of the headline.
Finding 2: the volume grew 130×. The usage didn't.
This is the chart that dissolves the debate.
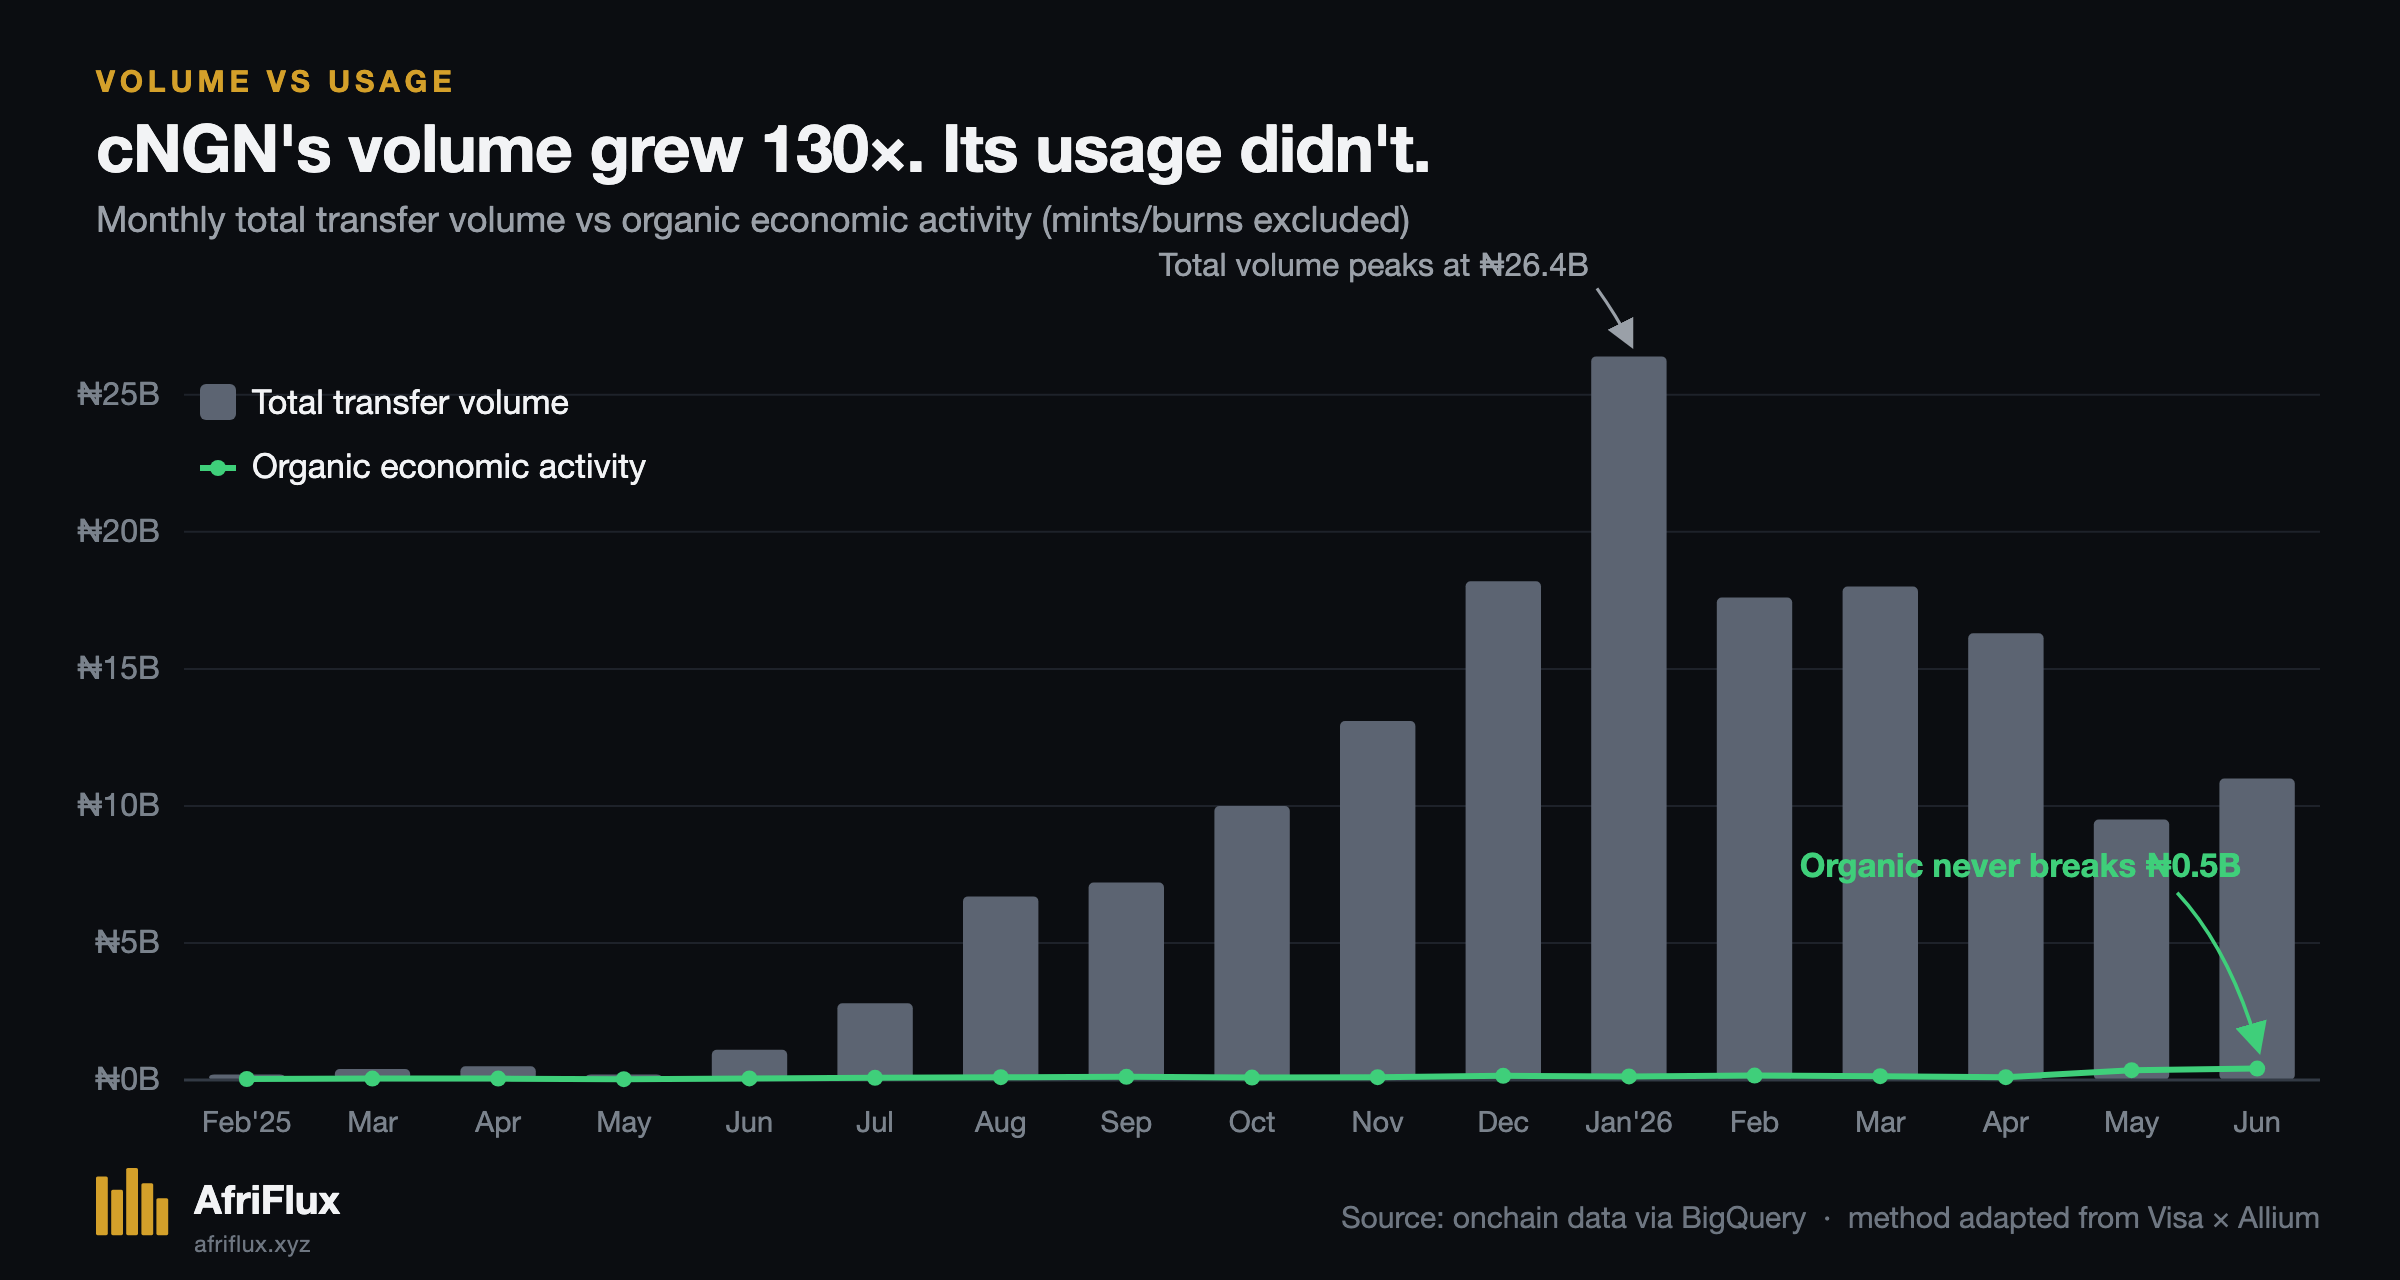
In its first two months, cNGN was tiny but genuinely organic — in February 2025, real economic activity was 87% of a small total. Then the headline volume took off. By January 2026 it had grown roughly 130-fold, past ₦26 billion in a single month.
The organic layer did not follow. It has bounced around ₦40 million to ₦400 million a month for cNGN's entire life. The grey bars climbed a mountain; the green line stayed in the foothills.
So the honest reading is neither "cNGN is winning" nor "cNGN failed." It's this: cNGN didn't fail to grow — the wrong thing grew. What scaled was infrastructure. Real economic use stayed small and roughly flat.
There is one genuinely encouraging note, and we won't bury it: the two most recent complete months, May and June 2026, show the highest organic volume in cNGN's history — ₦354M and ₦413M. Small in absolute terms, but the direction, right now, is up. That is worth watching.
Finding 3: the real layer is wide but shallow
Zoom into that 1.5% — the ~5,900 addresses doing genuine, arms-length cNGN activity — and it's a barbell.
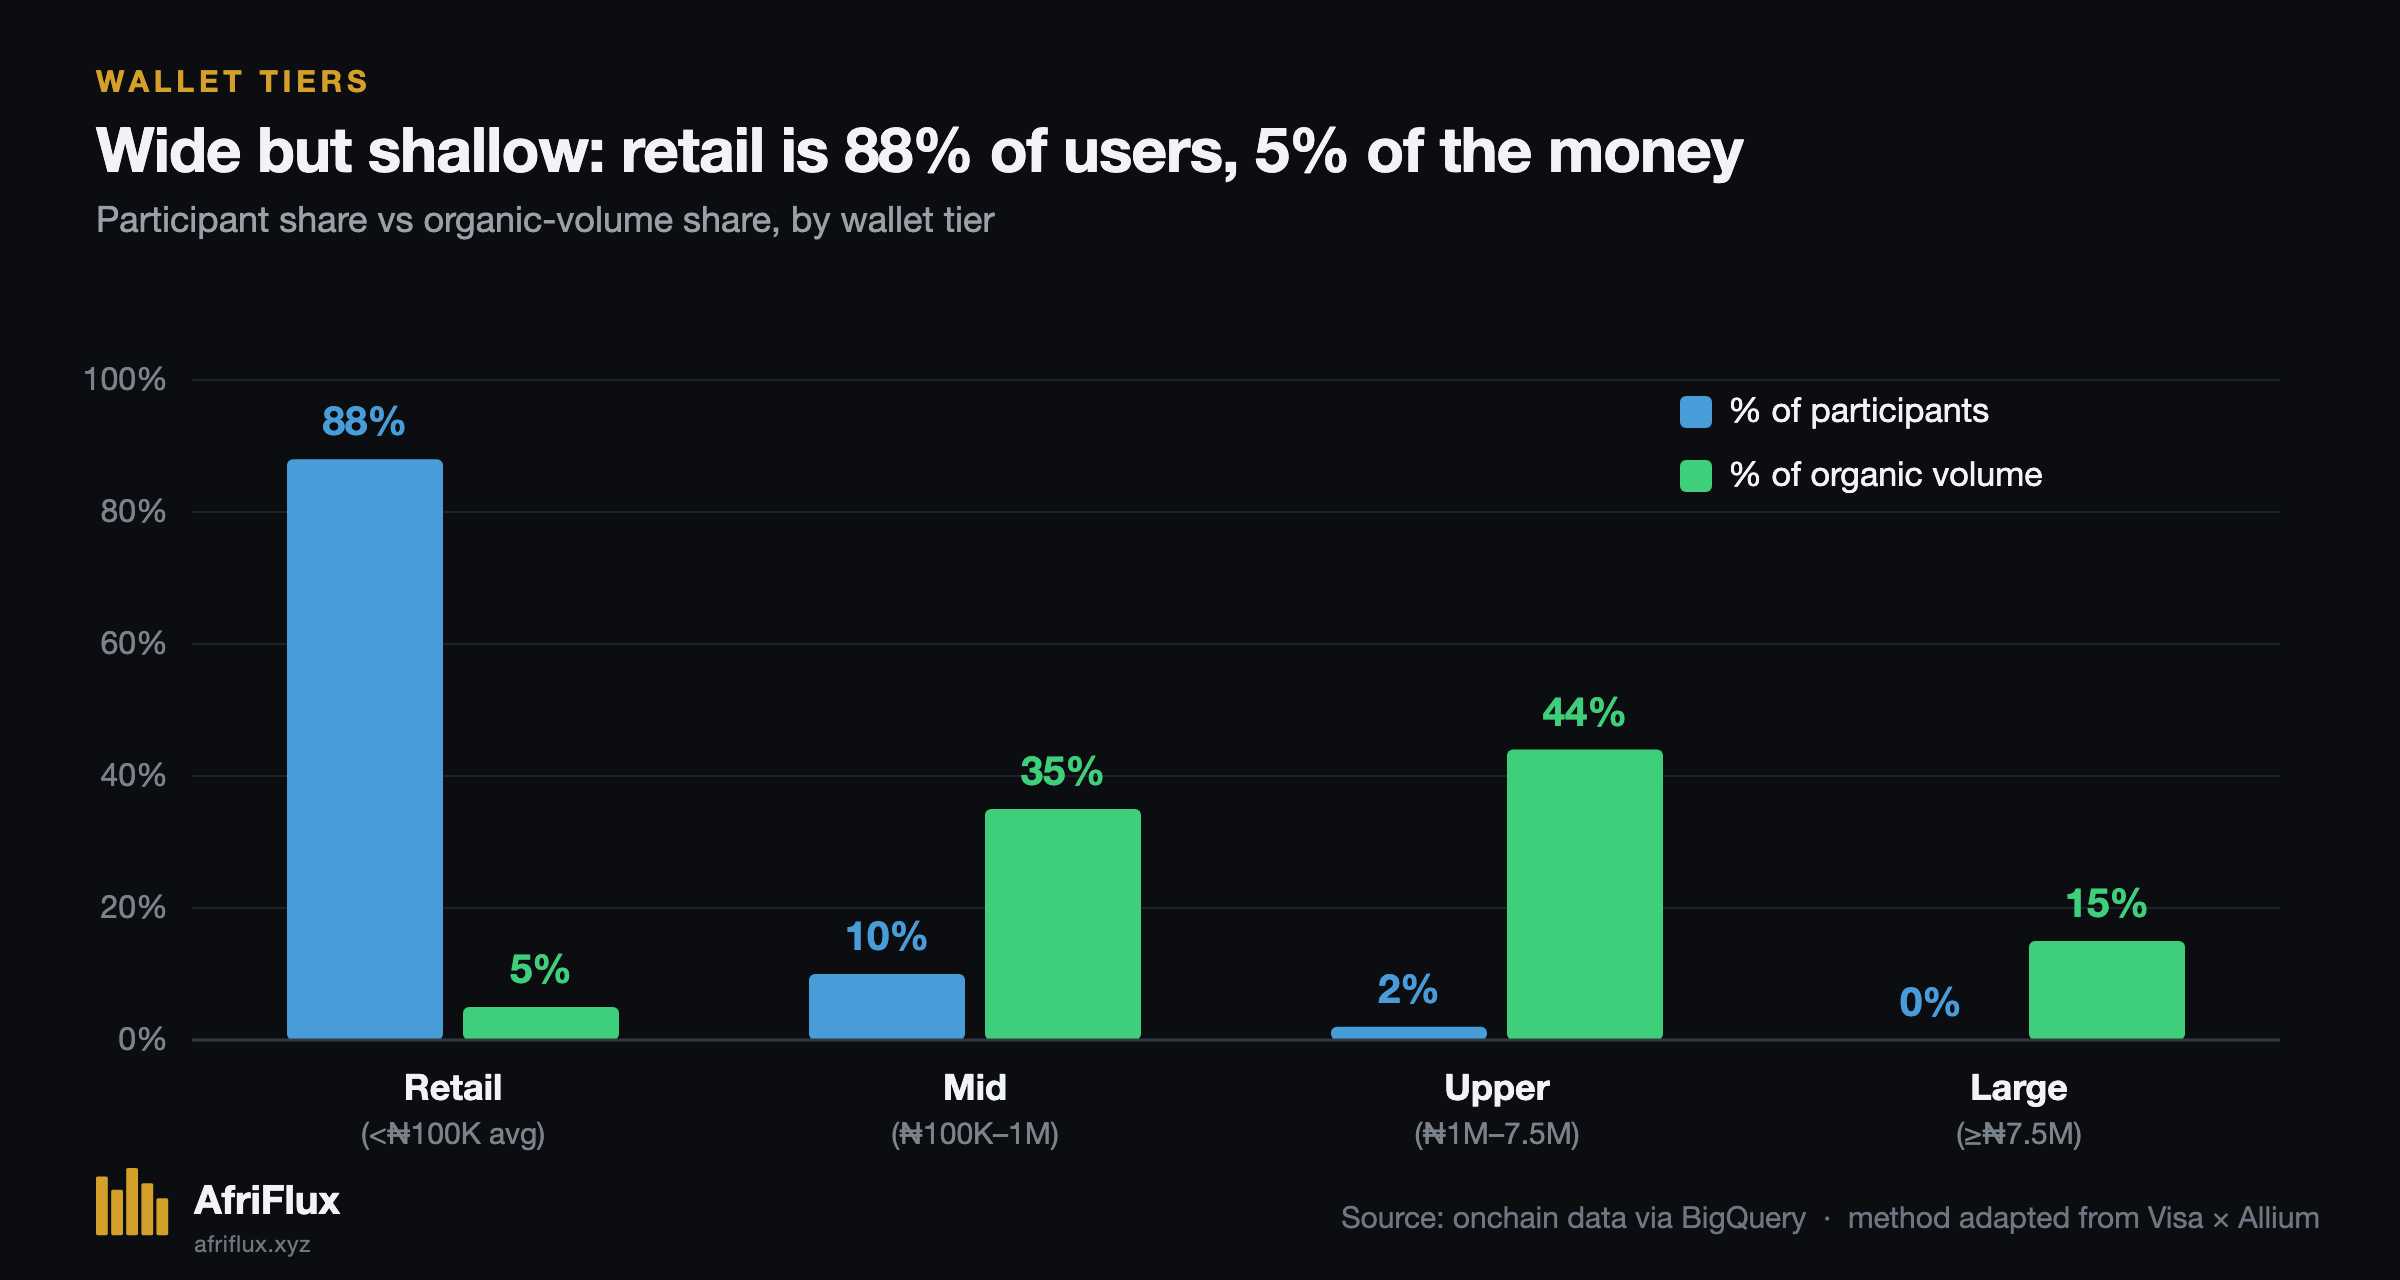
Retail wallets are 88% of the participants but only 5% of the money. They exist — thousands of them, transferring small amounts — but most transact once and disappear (of ~5,200 retail addresses, roughly 3,000 are one-and-done). The real economic weight sits with about 700 mid- and upper-tier wallets that carry 80% of organic volume, and these are the sticky ones: they come back, transacting over weeks and months.
Translated: cNGN's real usage isn't a broad consumer base. It's a modest cluster of recurring mid-sized actors — likely businesses and serious traders — with a wide, thin retail fringe around them.
Finding 4: it's reaching venue balance sheets, not venue users
This is where AfriFlux can see what others can't — and where the data is genuinely harder to read, so we're going to show you two different lenses and be explicit about what each one measures.
First, where the organic flow goes. Of the real, arms-length cNGN, how much reaches the platforms Nigerians use?
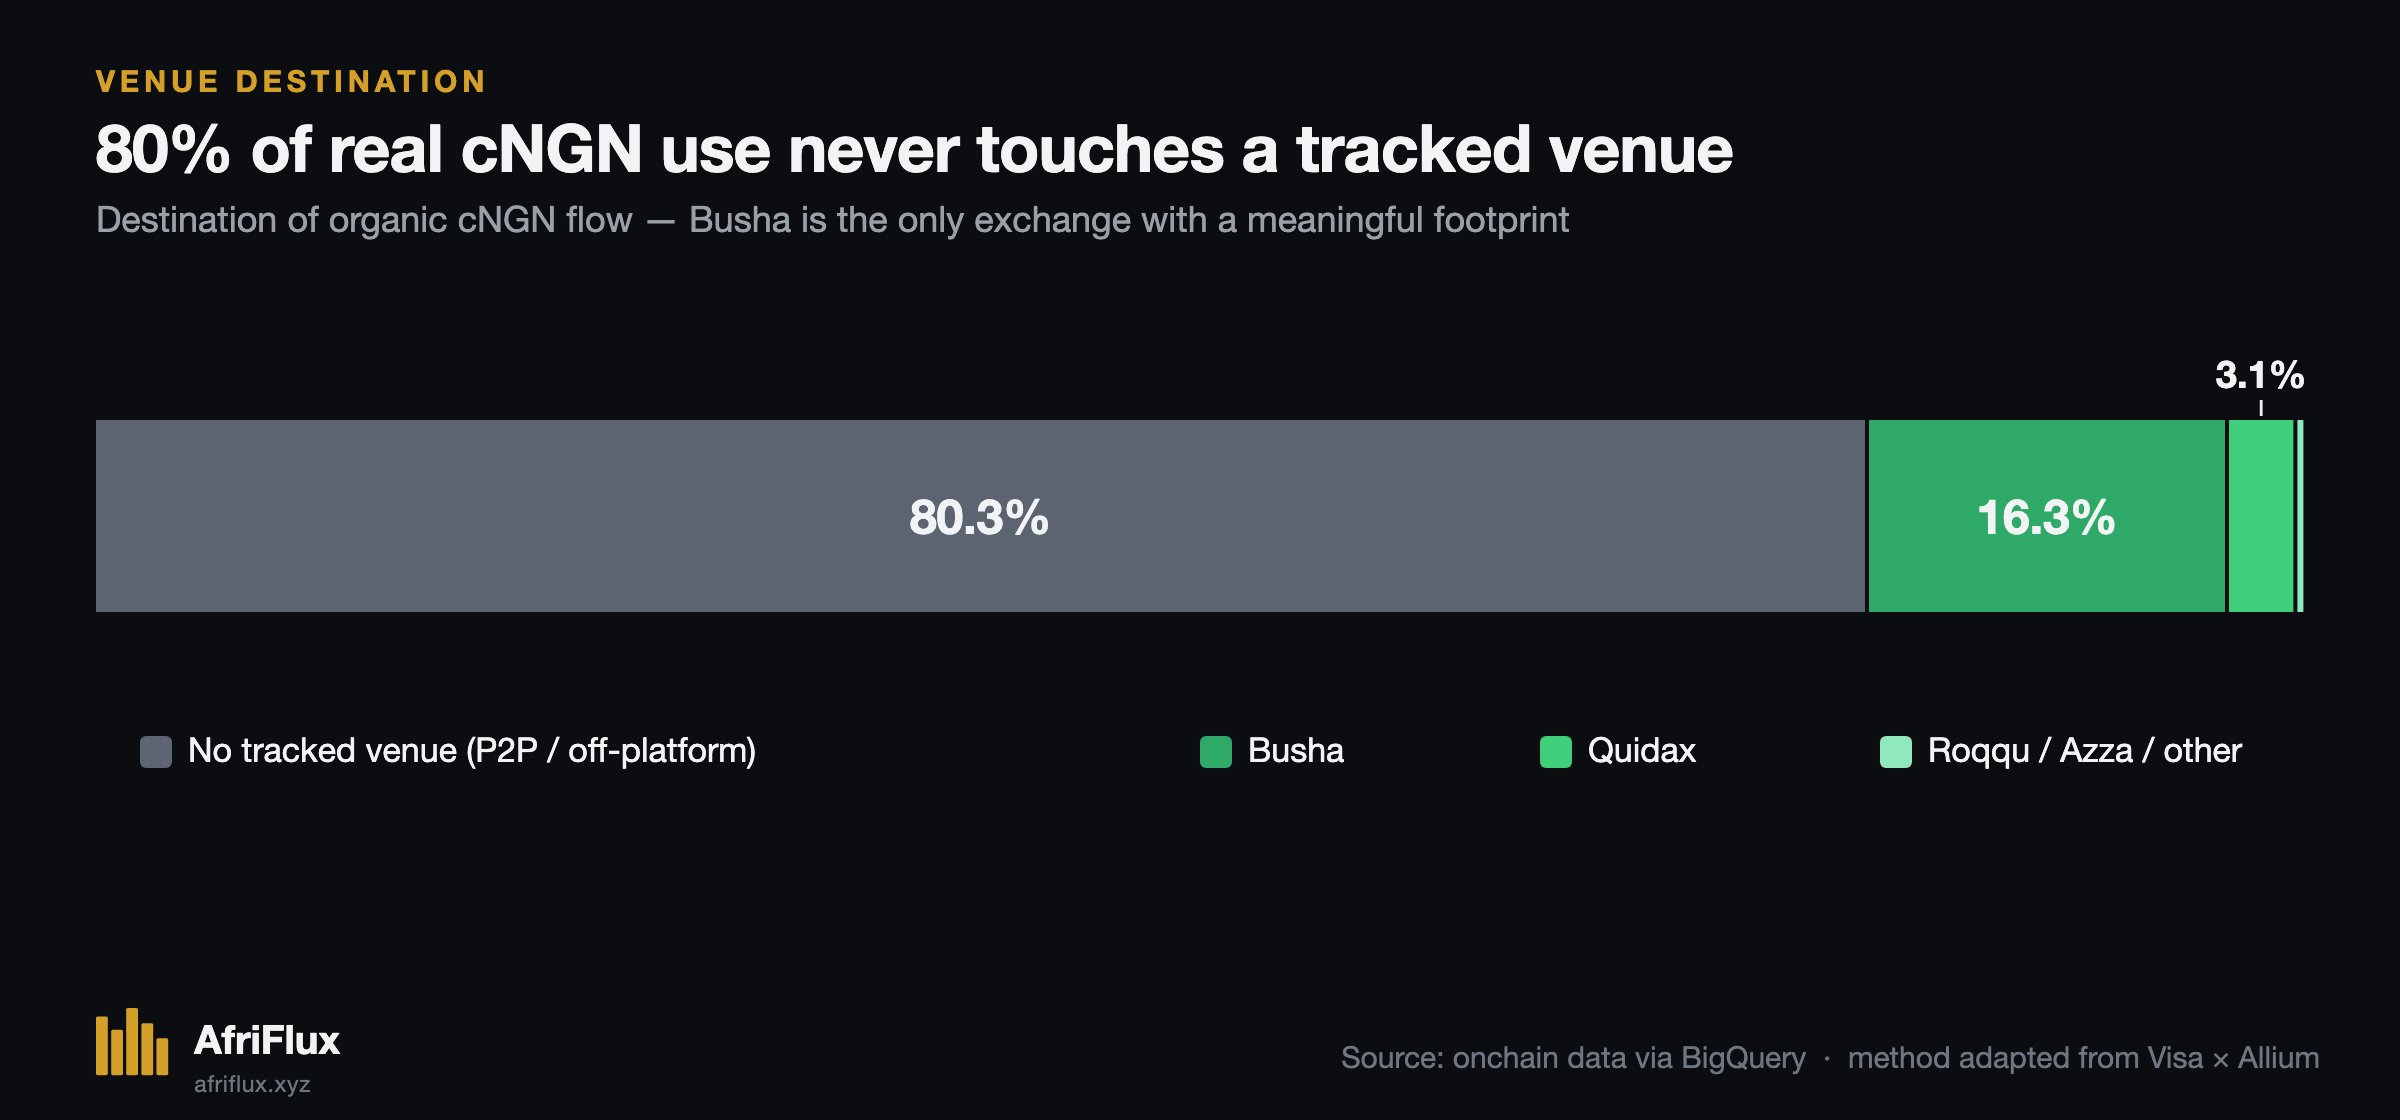
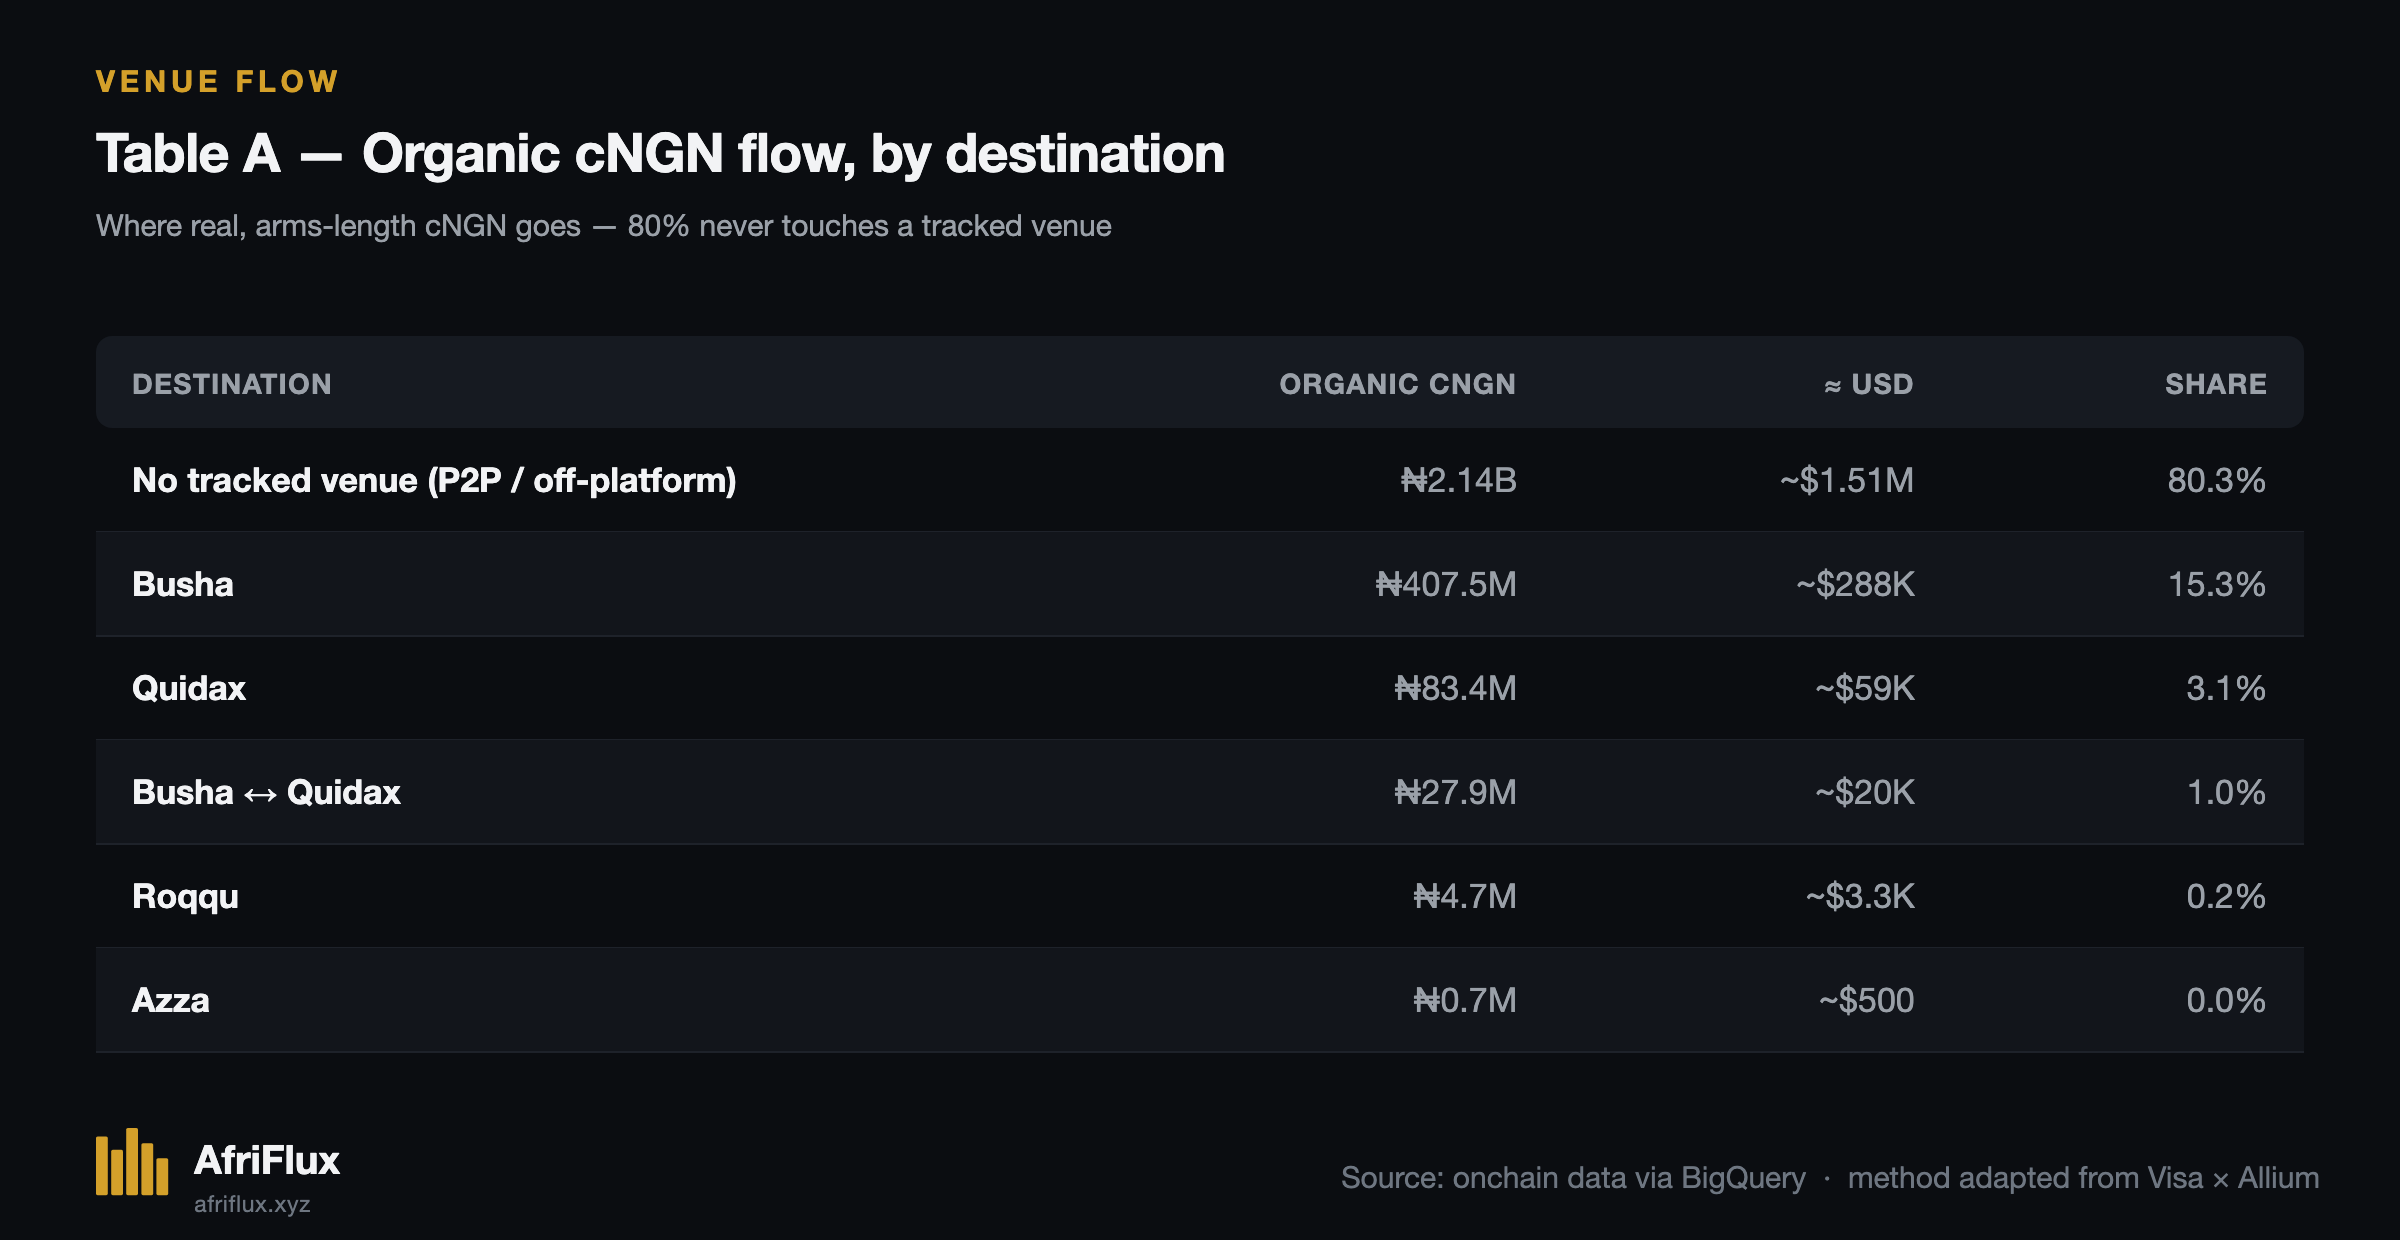
80% of it doesn't. Genuine cNGN activity is happening overwhelmingly off the venues we track. Of the fraction that does touch a tracked venue's wallets, Busha leads:
Now the second lens, and the one that answers "are users actually depositing cNGN?" We map venue deposit addresses — the wallets a customer sends to when they move funds onto a platform. Here we have to flag a hard limitation up front: these deposit addresses were originally enumerated from USDT and USDC activity. So this lens sees a venue's cNGN deposits only if they arrive on the same addresses the venue uses for dollar stablecoins. Where a venue runs cNGN on separate infrastructure, we're looking at the wrong doors — and a near-zero reading means "not on the rails we mapped," not proven absence.
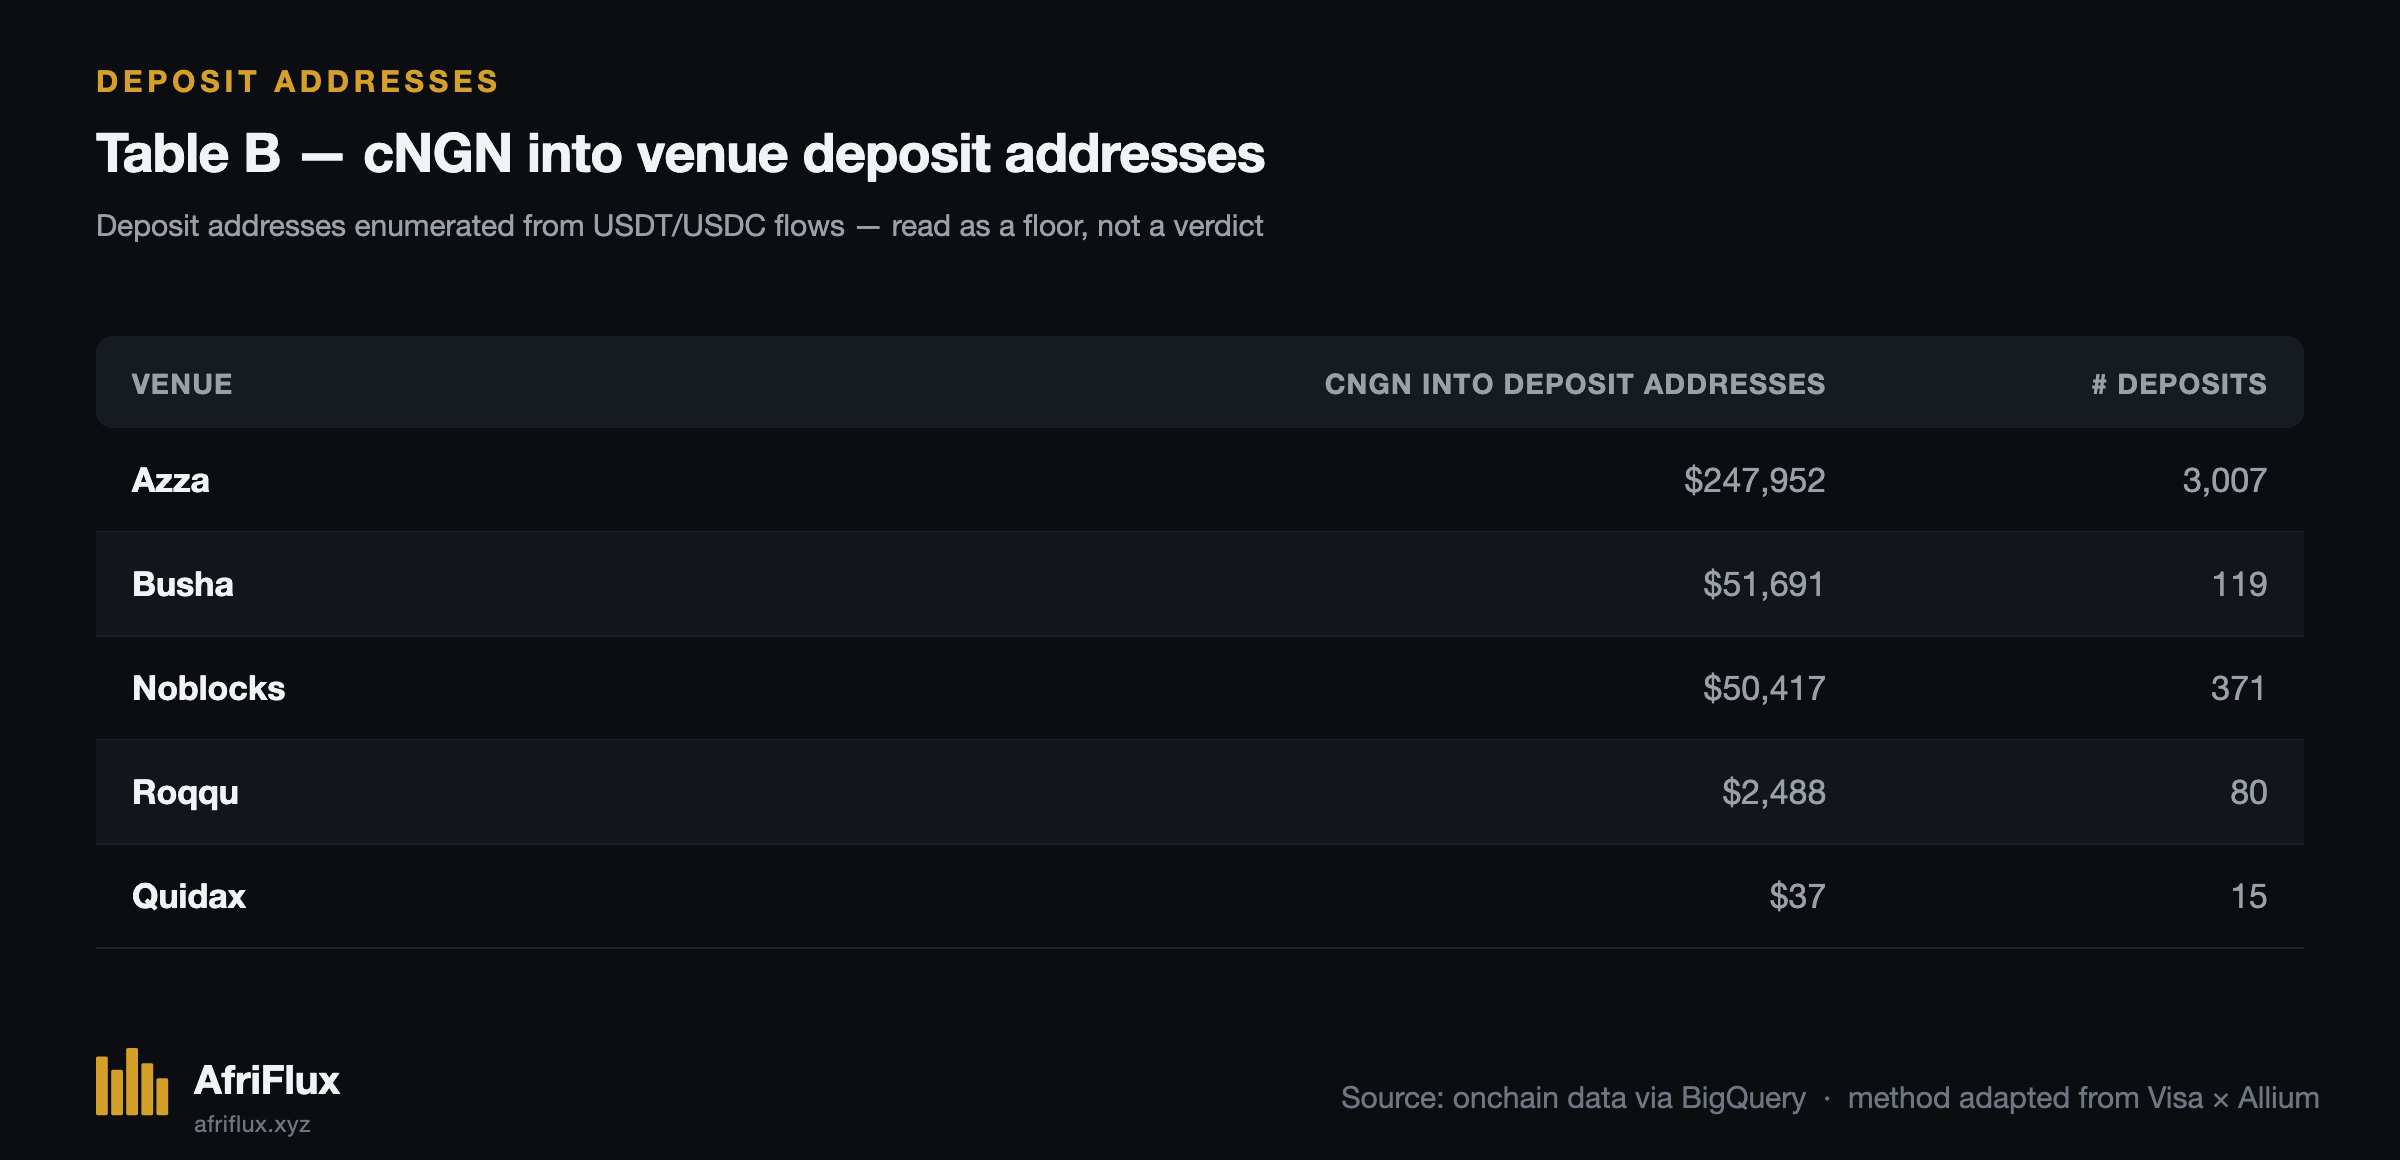
The two lenses rank venues differently, and that difference is the point. Table A measures organic flow through any wallet a venue controls — treasury, hot, collection. Table B measures the narrow slice landing in the deposit addresses where customers actually top up. Read together, they say something the headline volume never could:
cNGN is reaching venue balance sheets, not venue users. Quidax is the cleanest example: roughly $59,000 of organic cNGN moves through its wallets, but its mapped deposit addresses have received $37. The token reached the exchange. It did not reach the exchange's customers.
Azza cuts the other way and we won't pretend it's clean: it barely registers in organic flow (Table A) yet leads deposit volume (Table B). The likely explanation is that Azza is an off-ramp, and its high-frequency deposit-collection machinery gets classified as infrastructure by the adjusted-volume filter — so raw deposits are large while organic flow reads near zero. That is our current read, not a verified one, and we flag it as an open reconciliation rather than dress it up.
What holds across both lenses: among the exchanges that have listed cNGN, its footprint on the rails where ordinary users transact is tiny. That's the "fintechs aren't integrating it" critique, answered — with numbers, and with an honest account of what our instruments can and can't yet see.
The BIS lens: cNGN is minted, moved, and redeemed — not held
Step back from usage and look at the token's life cycle. The BIS 2026 report maps stablecoins on a continuum: at one end, money-like instruments that function as a means of payment; at the other, investment-like instruments held as a store of value. Its verdict on the current crop leans skeptical — most designs, it argues, resemble ETF shares more than money.
Where does cNGN sit? The supply data is unambiguous.
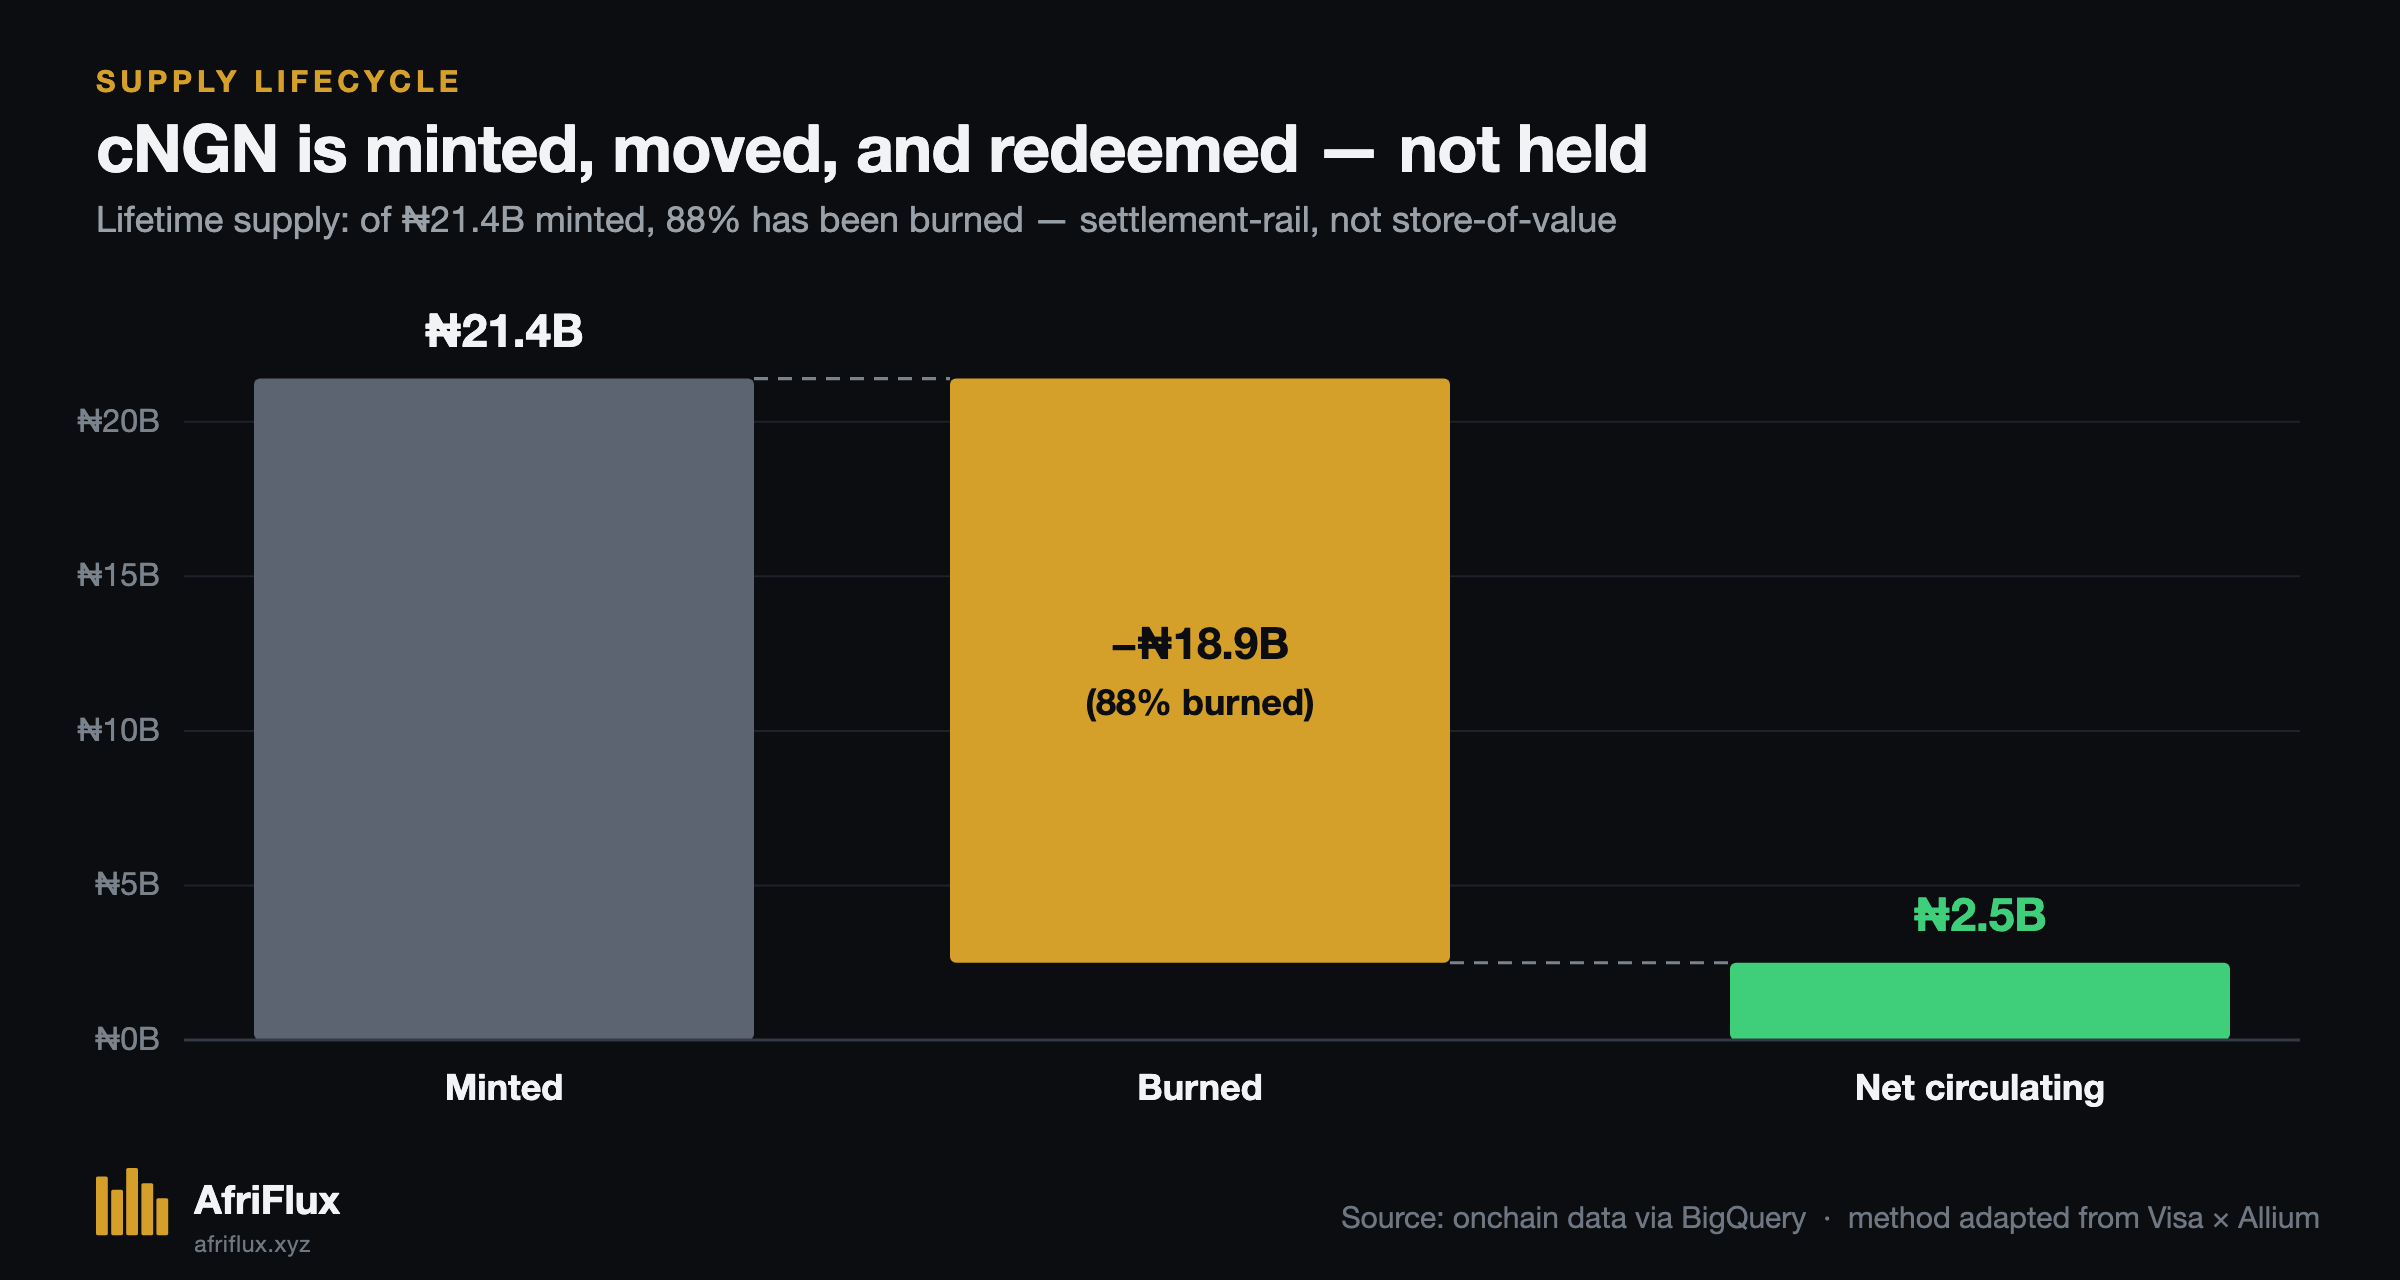
Of the ₦21.4 billion ever minted, 88% has been burned. Only about ₦2.5 billion is left standing as net circulating supply. cNGN is overwhelmingly a mint → move → redeem instrument: tokens are created, used for a settlement or a transfer, and destroyed on the way back to naira. Almost nothing is held.
On the BIS continuum, that reads as settlement-rail behaviour, not store-of-value. Which reframes the entire PMF question one more time: cNGN was arguably never built to be held like money. It was built to move and be redeemed. So "nobody holds cNGN" isn't a failure — it's the design working. The real open question is whether enough people are moving it. And the answer, from Finding 2, is: not yet at any scale.
What this actually means
The debate asked a binary question — does cNGN have product-market fit? — and the chain refuses to answer in binary.
Measured against the job of a retail payments token, cNGN is early and small: real retail is a thin, mostly-transient fringe.
Measured against the job of a settlement instrument, it's doing something real but narrow: a mint-move-redeem rail used by a modest set of recurring mid-sized actors, largely off the exchanges.
Measured against the job of displacing dollar stablecoins for everyday Nigerian use, there's no evidence yet: ₦2.5B of net circulating supply and ₦258M of retail-sized organic flow is not a currency in broad circulation.
None of that is "winning" or "failing." It's a token that has found a small, specific groove and hasn't yet broken out of it. The reason the argument couldn't resolve is that both sides were staring at the ₦163B — a number that is overwhelmingly infrastructure — and projecting their priors onto it.
The better question was never how much volume? It's what kind?
Limitations
We'd rather state these than have them thrown at us:
- Our labels drive our results. cNGN's organic layer is only as visible as our wallet mapping. On chains where we've labeled little (Solana, Lisk), the method over-reports "organic" because nothing gets flagged as infrastructure. We report Base and BSC with confidence; the smaller chains, less so.
- The venue deposit lens is USD-built. Our deposit-address map was enumerated from USDT/USDC activity. A venue reading near-zero for cNGN deposits may simply run cNGN on infrastructure we haven't mapped. Table B is a floor, not a verdict.
- The cutoffs are ours. The 150-transaction and ₦150M thresholds are calibrated judgment, not physical law. Move them and the exact percentages shift. The shape of the finding — a small organic layer under a large infrastructure mass — is robust to reasonable changes; the second decimal place is not.
- "Organic" is a proxy, and it's address-level. It means arms-length, non-infrastructure, non-same-entity flow. It's the best available proxy for real economic use, but one person can hold many wallets, and custodial wallets hide many people. We count participants, not users.
- ~8% of volume is inferred infrastructure. One large cluster of high-frequency wallets behaves unmistakably like automation but isn't yet named. We classify it by behaviour and say so.
Methodology
AfriFlux classifies cNGN activity by observable behaviour, not raw transfer count. Every transfer is passed through a scale-adapted version of the Visa × Allium adjusted-volume method, plus the BIS same-party netting adjustment:
- Single-directional filter — largest transfer leg per transaction only.
- Inorganic flag — any address exceeding 150 transactions or ₦150M in volume in any 30-day window (cNGN-calibrated equivalents of Visa's 1,000-tx / $10M cutoffs).
- Same-entity netting — transfers where both wallets belong to the same labeled entity are removed.
- Retail-sizing — organic transfers under ₦375K (~$250).
Mints and burns are excluded from all transfer figures; they are supply events, not usage. Venue deposit volumes (Table B) are measured against deposit addresses originally enumerated from USDT/USDC activity, and should be read as a lower bound. Where a wallet is unlabeled, it is classified by behaviour and flagged as such. Where uncertainty exists, it is documented above rather than hidden.
References: Visa Onchain Analytics methodology · Allium · BIS Annual Report 2026, Ch. III
This is the first of a series
The Native Stablecoin Hub applies this same lens across every African-issued stablecoin — cNGN, ZARP, cKES, and the rest — measuring not just how many tokens move, but how much of that movement is real.
Because the success of a native stablecoin was never going to be decided by how much volume it can print. It'll be decided by whether that volume represents the problem the coin was built to solve.
We'll keep counting.
— AfriFlux